Flint’s AI-powered Data Table Analysis Tool helps teachers make sense of student data without spending hours in spreadsheets.
Whether you're reviewing assessment scores, tracking attendance patterns, analyzing formative check-ins, or comparing growth across classes, manually interpreting data tables can be time-consuming and overwhelming. Our AI data table analysis tool transforms raw data into clear, actionable insights in seconds. Upload or paste your data table, and Flint highlights trends, identifies outliers, summarizes performance patterns, and suggests instructional next steps, all in plain language.
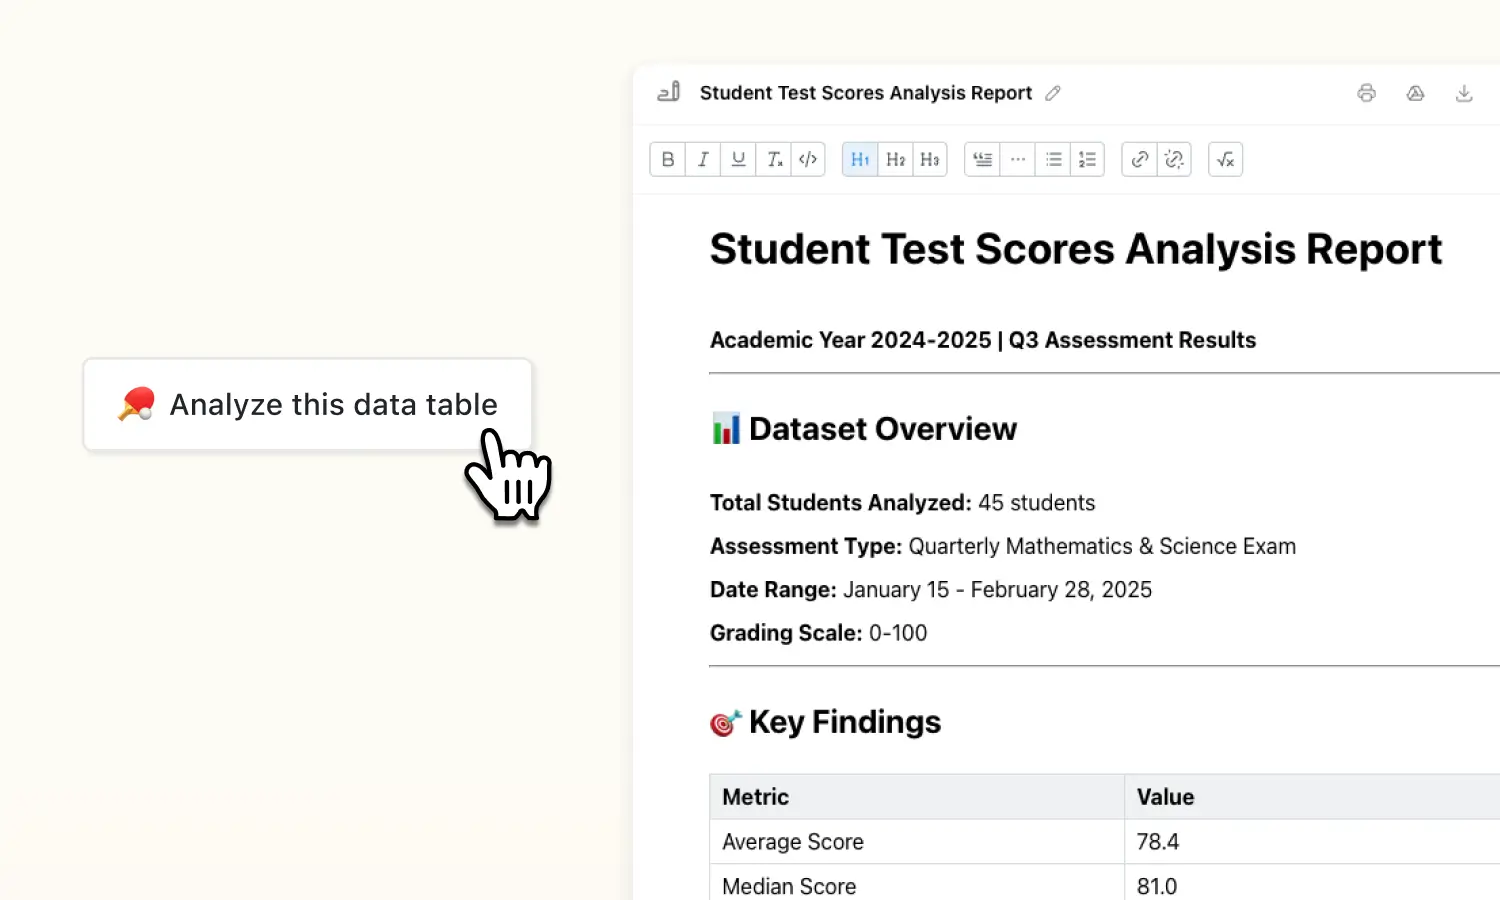
Instantly analyze student performance data
Upload or paste any data table — from assessment results to attendance logs — and get immediate summaries of trends, averages, growth patterns, and performance gaps. No formulas, pivot tables, or advanced spreadsheet skills required.
Identify trends, outliers, and instructional gaps
Flint highlights meaningful patterns teachers might otherwise miss. Quickly spot struggling students, identify standards that need reteaching, and recognize high-growth trends across periods or classes.
Generate clear, actionable insights
Instead of just presenting numbers, the tool translates data into plain-language insights and suggested next steps. Use the analysis to inform small-group instruction, intervention plans, reteaching strategies, or parent communication.
Analyze math assessment data to guide reteaching
Upload quiz, test, or benchmark data to quickly identify which standards students struggled with most. Instantly see patterns in computation errors, problem-solving gaps, or multi-step question performance so you can target reteaching where it matters most.
Break down reading and writing performance trends
Use the tool to analyze literacy assessment tables, rubric scores, or reading comprehension data. Spot trends in vocabulary, inference skills, writing organization, or grammar performance — and group students strategically for small-group instruction or intervention.
Track science and social studies mastery over time
Monitor standards mastery across units, labs, or projects. Compare class periods, evaluate growth from pre- to post-assessments, and identify content areas that may need reinforcement before state testing.
AI worksheet grader
Our AI Worksheet Grader instantly analyzes, annotates, and scores assignments based on your rubric and individual student needs.
AI essay grader
Our AI Essay Grader carefully reviews student essays, grades, and provides detailed feedback according to your own grading rubric.
Survey creator
Need quick feedback from students, families, or staff? Flint’s easy-to-use Survey Creator helps K–12 teachers build custom surveys in minutes.

